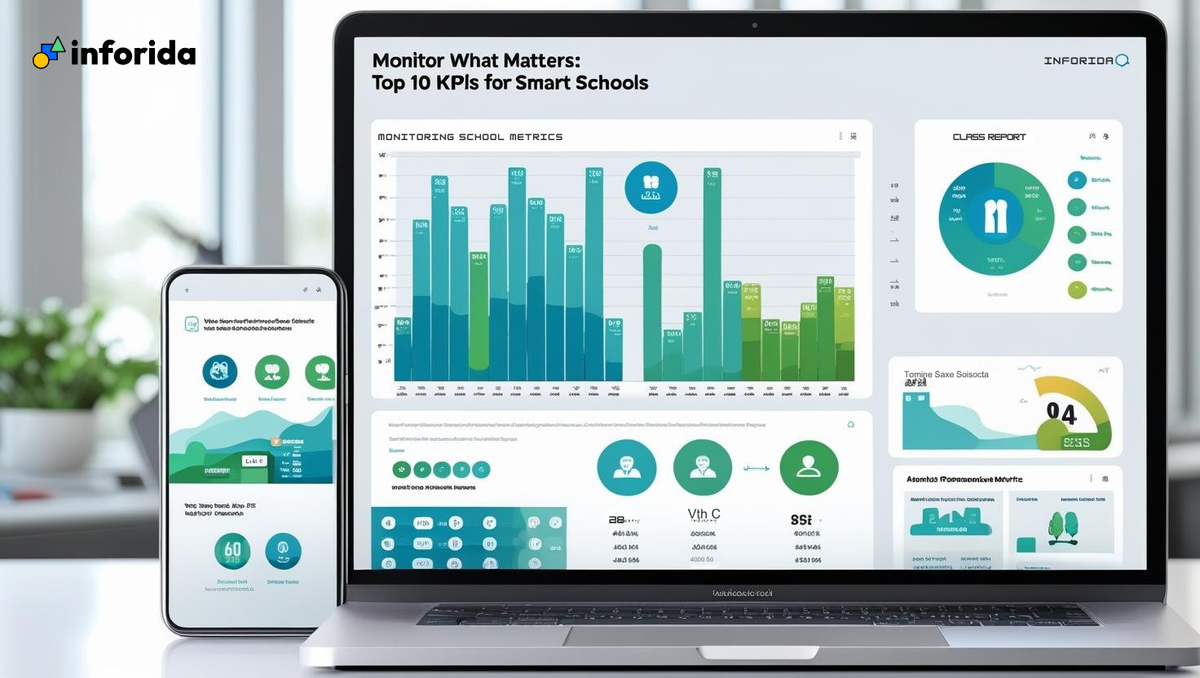
Top 10 KPIs That Matter in a Digitally-Managed School

📊 Improve school strategy with data-backed decisions
Introduction: Why KPIs Matter in the Modern School Ecosystem
Imagine running a school where every decision is backed by data—where you don’t guess whether fee collections are lagging, or if parent engagement is declining. Instead, dashboards give you live insights. That’s the power of managing your school with an ERP system like Inforida.
Key Performance Indicators (KPIs) aren’t just for businesses. In digitally-managed schools, KPIs help leaders focus on what really matters—student success, teacher efficiency, parental involvement, and financial health.
This blog uncovers the 10 most critical KPIs you should monitor today—and how software like Inforida makes that possible effortlessly.
1. 🎓 Student Attendance Rate
Low attendance often signals deeper issues like disengagement, academic stress, or logistical barriers. The Inforida team while working with different schools have noticed that in many cases attendance is tied to performance and funding.
Inforida came up with an easy solution to help track student’s presence accurately with their real-time facial recognition.
📌 Pro Tip: Use attendance trends to plan interventions early.
2. 💸 Fee Recovery Rate
Is your school collecting 100% of fees on time? If not it should be doing so efficiently as it directly affects school cash flow and operational capacity. It offers ERP solutions tailored for K–12 schools having features of automated reminders, online payments, and default analytics which helps in simplifying collection.
You can also track overdue accounts in one click and set automated follow-up and reminders.
3. 🧑🏫 Teacher Login & Task Completion
Are your teachers engaging with the digital platform? It is very important of teachers to have an understanding of digital platforms as low activity might signal tech fatigue or training gaps among staff.
Inforida helps you to track daily activities like login, lesson planning, and all these task tracking will be visible to admins.
📌 Pro Tip: You can build training programs based on activity heatmaps.
4. 📝 Assignment Submission Rate
How many students are submitting assignments on time? This is also an important metric to be aware of for the teachers as it reflects students accountability and system usability.
Inforida ERP solution helps teachers to instantly track missing submission and alert parents on performance reports
📌 Pro Tip: Use these insights for parent-teacher meetings.
5. 🗣️ Parent Engagement Metrics
Are parents opening app messages or attending events? It helps in parent’s engagement that gradually improves student outcomes in work.
Inforida’s Orbit App is designed to monitor metrics like Click-throughs, number of people who read the message, and clear visuals with attendance logs.
📌 Pro Tip: Push notifications with interactive content boost engagement.
6. 📚 Library Utilization Rate
Yes, even digital libraries need performance metrics. You must be wondering how it matters? Well, digital libraries measures interest in extra reading and student curiosity
Inforida ERP Solution tracks digital resource downloads and borrowing trends, all the one place.
📌 Pro Tip: Suggest most-read books in newsletters to promote reading.
7. 🧠 Academic Performance Index
Are students improving across terms? Having the clear data of students' performance which in the bigger picture of a nation's growth with central to the school’s educational mission.
Inforida got you covered with AI- generated reports cards and subject wise analytics help spot learning gaps and create a personalized plan for each student to improve and grow.
📌 Pro Tip: 🎯 Intervene based on individual or group trends.
8. 💬 Helpdesk Response Time
How fast is your school responding to the parent’s concerns? Response time affects parent satisfaction and trust.
Inforida insight helps you track ticket generation, resolution time, and satisfaction score.
📌 Pro Tip: 📍 Streamlined support builds a more professional image.
9. 🏫 Admission Inquiry Conversion Rate
Are you turning inquiries into enrollments? Because it directly impacts school growth rate.
The QuickEnroll AI tracks conversion percentages by counselor, channel, and follow-up stages.
📌 Pro Tip: Optimize campaigns and counselor performance accordingly.
10. 🔄 ERP Adoption Rate
Now the bigger question arises - How deeply is your staff using the ERP?
The more teachers and staff get used to it the more clear and descriptive insights you gain which help you understand the gap and resolve it with proper strategic planning and report. Inforida adoption dashboard track usage by module and role.
📌 Pro Tip:: Use gamification to increase adoption—leaderboards, badges, etc.
Conclusion: Build a Smarter School with Inforida Dashboards
When school decisions are powered by clear metrics, everything gets easier—from managing classrooms to winning parent trust. ERP dashboards shouldn’t be a luxury—they’re a necessity in modern school leadership.
With Inforida, you don’t need to be a data scientist to understand what’s working. You just need to log in.
✅ Ready to unlock the power of real-time school intelligence? Improve school strategy with Inforida now and see the result you ever expected to achiev

